The new year has been extremely chaotic with work and shoveling (I live in the DC metro area), which has been detrimental to my blogging. Leave it to a random reader to spur my creative bone – albeit to my technical side.
A commenter asked in response to my Visual Basic capsule on writing code to make Gantt bar colors match resources, a question about formatting based on the tasks. Here is the comment:
- The code works and I accept that there is no non VBA method of achieving the result above.
But I know that you can change the colour of bars for example to Blue or Red depending on whether the car is critical or not via Format bar styles. Can you specify a colour for the bar if the task is behind schedule without Code?
The quick answer to the question is ‘yes’, but you will likely have to think like a developer in order to get the result that you want. The good news is that you won’t need VBA to do it.
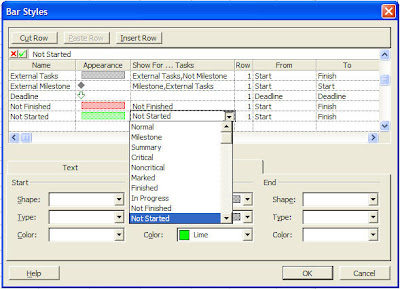
The primary place the action will take place is in the Format Bar Styles dialog (select Format | Bar Styles). The default list shows how MS Project applies bar styles for the open project are shown. The list shows the types and order in which the styles are applied. This means that if a task falls into two or more row criteria, the row closest to the bottom of the list will be the one that is applied.
For example, I have taken a screen shot of two custom row criteria that I entered to get close to what I think of as “behind schedule” – Not Started and Not Finished. I have put Not Finished before Not Started, since all tasks must start before they can finish. If I had reversed the order, putting Not Started first, that color (or colour) would never appear.
 If you aren’t confused yet about putting things in the proper order, this little experiment highlights a problem with using just the Bar Styles dialog to accomplish this task – the requirements. John wants to know how to show tasks that are “behind schedule”. Showing tasks that have not started or finished do not speak to the state of the task. To do that, we need to base our criteria on either the baseline or the current (or status) date.
Managers who are seeking to show tasks “behind schedule” using baseline are looking for historical reports. Managers who are seeking to show tasks “behind schedule” using current date or status date are seeking to refine the format of the schedule to highlight where the problem areas lie. Both are valuable goals, and both can be accomplished with using VBA code. The former is the easier of the two (and does not require custom fields), so I will deal with that first.
Baselines. MS Project (2003) offers 21 different default categories (such as Critical), and each can be combined with a comma – e.g., see the settings for “External Milestone”. The comma represents an “and” for development, not an “or”, meaning all criteria listed in the row must be satisfied to affect the bar style. Since I don’t have any other data to go on than “behind schedule”, I am going to use the following base formula to determine tasks that are “behind schedule”:
- BS = Started Late (Tasks with a scheduled start date later than the baseline start date) AND Finished Late (Tasks with a scheduled finish date later than the baseline finish date)
- BS = (Started Late AND Finished Late) OR Finished Late.

Now for the trickier part…
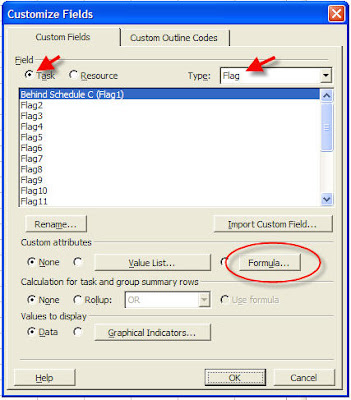
Current Date. There are no default categories that point to the current date or status date, but there are 20 custom Flag fields we can use. In this case, I’m going to use Flag1 and make the color Lime green, so I can see the difference in my project. (For the purposes of this experiment, I am going to assume it is more important – i.e., put lower in the bar list – to highlight tasks that are behind as of today versus behind in versus the baseline.)
 Click “OK” to close the dialog, and then select Tools | Customize | Fields. In the Custom Fields dialog, use the right drop-down to select “Flag” for Task Fields. Rename Flag1 as (in this case) “Behind Schedule C” for traceability* and then click the Formula button.
 As with the Baselines, now we need to start with a base formula for behind schedule. I will use the following:
- BS = ([% Complete]< 100 And [Finish]<[Current Date]) OR [Start]<[Current Date] And [% Complete]=0)
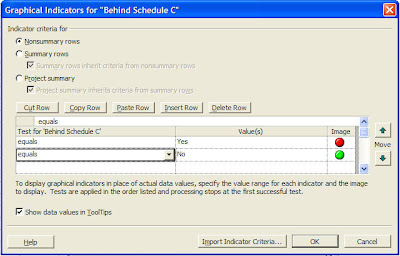
We have another slight caveat with Flag, and that is that Flag fields give a strictly “Yes” or “No” or blank output. Using the Function button and select Function -> General -> IIF to paste a generic “If, then, else” statement into the text box.
The end result looks like this (cut/paste into dialog):
- IIf(([% Complete]<100 And [Finish]<[Current Date]) Or ([Start]<[Current Date] And [% Complete]=0) Or ([% Complete]<100 And [Finish]<=[Current Date]),"Yes","No")

Testing/Viewing.Here’s a screen shot of various scenarios with the indicators and gantt bar colors in place:

Replicating: The MS Project Organizer does not have a section for Bar Styles, so you cannot upload the setting to your Global MPT file. Fields (such as Flag1) can be easily replicated. I recommend modifying your organization’s project templates and including a short ‘how to’ procedure in your organization’s PMO tips guide. It only takes a minute to set up.
Overall. MS Project can really make managing projects easy for you, if you put a little work into it.
* I highly recommend documenting all customizations in MS Project that become standard. Over the years, you can accumulate a lot of customized baggage that no one remembers what is used for, but because no one wants to break anything, it becomes part of the legacy application.
2 comments:
hey man, really thank you for this helpful post, you are my hero ;)
Good stuff. Appreciate you sharing this and will reference your site when the PMO asks me how I automated my gantt to match their color coding requests.
Post a Comment